Hello there, In this article, we will see”10 Key Performance Indicators (KPIs) for Your Ecommerce Store’s Growth”.
Have you ever wondered how these all successful businesses come to the top in a crazy short period of time? They might be doing the activities that maybe you’re not performing for your store.
They’re successful because they have an eagle’s eye on their KPIs (Key Performance Indicators), and make necessary changes when needed.
Speaking of KPIs, they are kind of a road to success for your eCommerce store, monitoring which works best for your store, for example improving your store’s sales traffic, and customers or not?
One can not set random KPIs, they should be chosen and monitored in accordance with your specific business objectives. However, there are some KPIs that may work for others but not for your store.
Well, we have covered a lot about Key Performance Indicators in this guide, so just sit back, we got a lot to share.
This guide will unfold some of the important eCommerce KPIs that you must know which can tell you where your store suffers and what points can be taken to solve the issues?
But before we get into the eCommerce KPIs, let’s just go through some of the important questions that must be addressed first.
What Are Ecommerce Key Performance Indicators?
To put it simply, KPIs are short forms of “Key Performance Indicators”. KPI work indicates how well the organization is running, and it assists in determining the path you need to take to achieve your business goals.
Using the right KPI for your store will provide you with valuable insights into the improvements that are required to improve the store’s performance.
Plus, the right eCommerce KPI will also tell you how you can improve your store’s performance by giving you meaningful insights.
Overall, KPIs are used to determine whether or not a company is progressing toward its objectives.
Why Are Ecommerce KPIs (Key Performance Indicators) Important?
KPIs are important even though your store is getting enough sales. If you don’t grasp the outcomes of your strategy, you won’t be able to properly develop your business and achieve your goals.
Rather than making decisions based on instincts and personal beliefs, it’s better to make smart and strategic decisions by having a KPI that tells you more about your business and your customers.
If you want to know the true value of KPIs, then it can be found in the actionable insights gained from data analysis.
The right KPI will let you know what’s actually going on in your business, and come up with problems that can take a look at. This approach will help your store increase sales.
Moreover, you can achieve long-term success by consistently taking the optimum actions.
Why And Which Ecommerce KPIs Should You Track For Your Ecommerce Website?
You may be wondering why you should track a KPI and how it might help you? Let’s know why you should track your KPI.
KPI Tracking
As you now already know, why are KPIs important?
A KPI can help you improve your store’s performance and assist you in a variety of ways, but you must monitor and measure it on a regular basis.
Believe in your KPIs, and you will see immediate improvements in statistics such as bounce rate, time on site, and so on.

Not only that, but KPIs will provide your site with unique, relevant data and insights that will allow you to fine-tune your business for improved user experience and revenues.
You now understand how vital it is to track your eCommerce website’s KPIs using a service like Google Analytics.
Which Ecommerce KPI To Track?
Now when it comes to tracking a KPI, which KPI would you track?
However, it is not possible for your store to track every KPI that you observe. Your business’s specific needs will determine which eCommerce KPI is best for you. When deciding which KPIs to track, you must consider the following factors:
1. The stage of your company’s development.10 Key Performance Indicators (KPIs) for Your Ecommerce Store’s Growth
2. The targets of your department.
3. Goals of your company.
Apart from that, you should select KPIs that are both attainable and actionable. Furthermore, we do not recommend tracking all KPIs; rather, you should look at your store and figure out what works best for it.
10 Most Important Ecommerce KPIs to Monitor
These are some of the most important eCommerce KPIs that we think should not be neglected. We chose these KPIs for you in order to assist you to increase your sales, revenue, and customer satisfaction.
All of this given eCommerce KPIs will give you the necessary insights into how your organization works. What will happen is that you could break on your ongoing losses and be more focused on potential growth.
How does that sound?
1. CAC: Customer Acquisition Cost
This KPI will tell you how much money you’re spending to get new customers for your business. It is calculated by examining sales costs and then adding marketing expenses. Customer acquisition cost is the one you shouldn’t take your eyes off of.
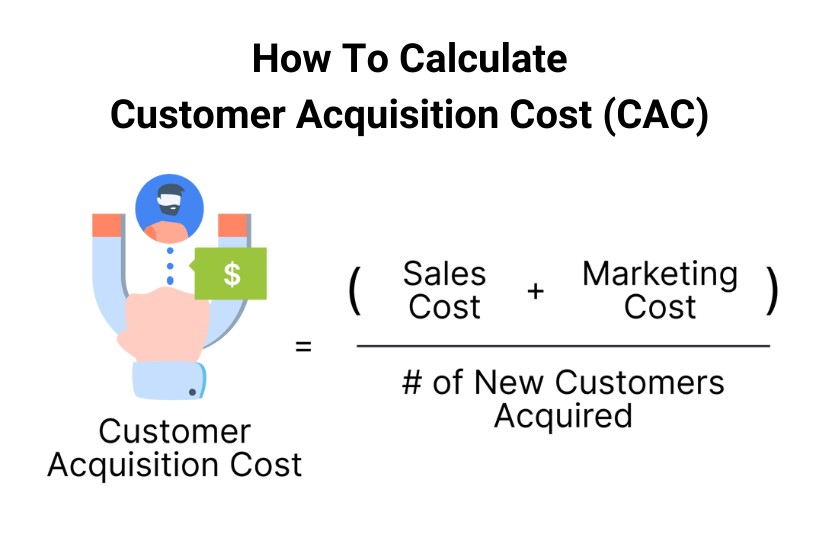
Understanding this KPI might assist you in keeping new customer acquisition costs as low as feasible in order to increase profitability.
Why is it vital to calculate customer acquisition costs?
It’s necessary because if you don’t know how much it costs to convert a lead into a paying customer, it is possible that your business could even fail.
Let’s understand it with the proper calculation
How Would You Keep Track?
(The money you spent to acquire customers ÷ Number of customers acquired = Customer acquisition cost.)
2. Conversion Rate
This is another crucial KPI to consider. The conversion rate shows how many users are on your site and about to take action such as making an account, purchasing something, and so on.
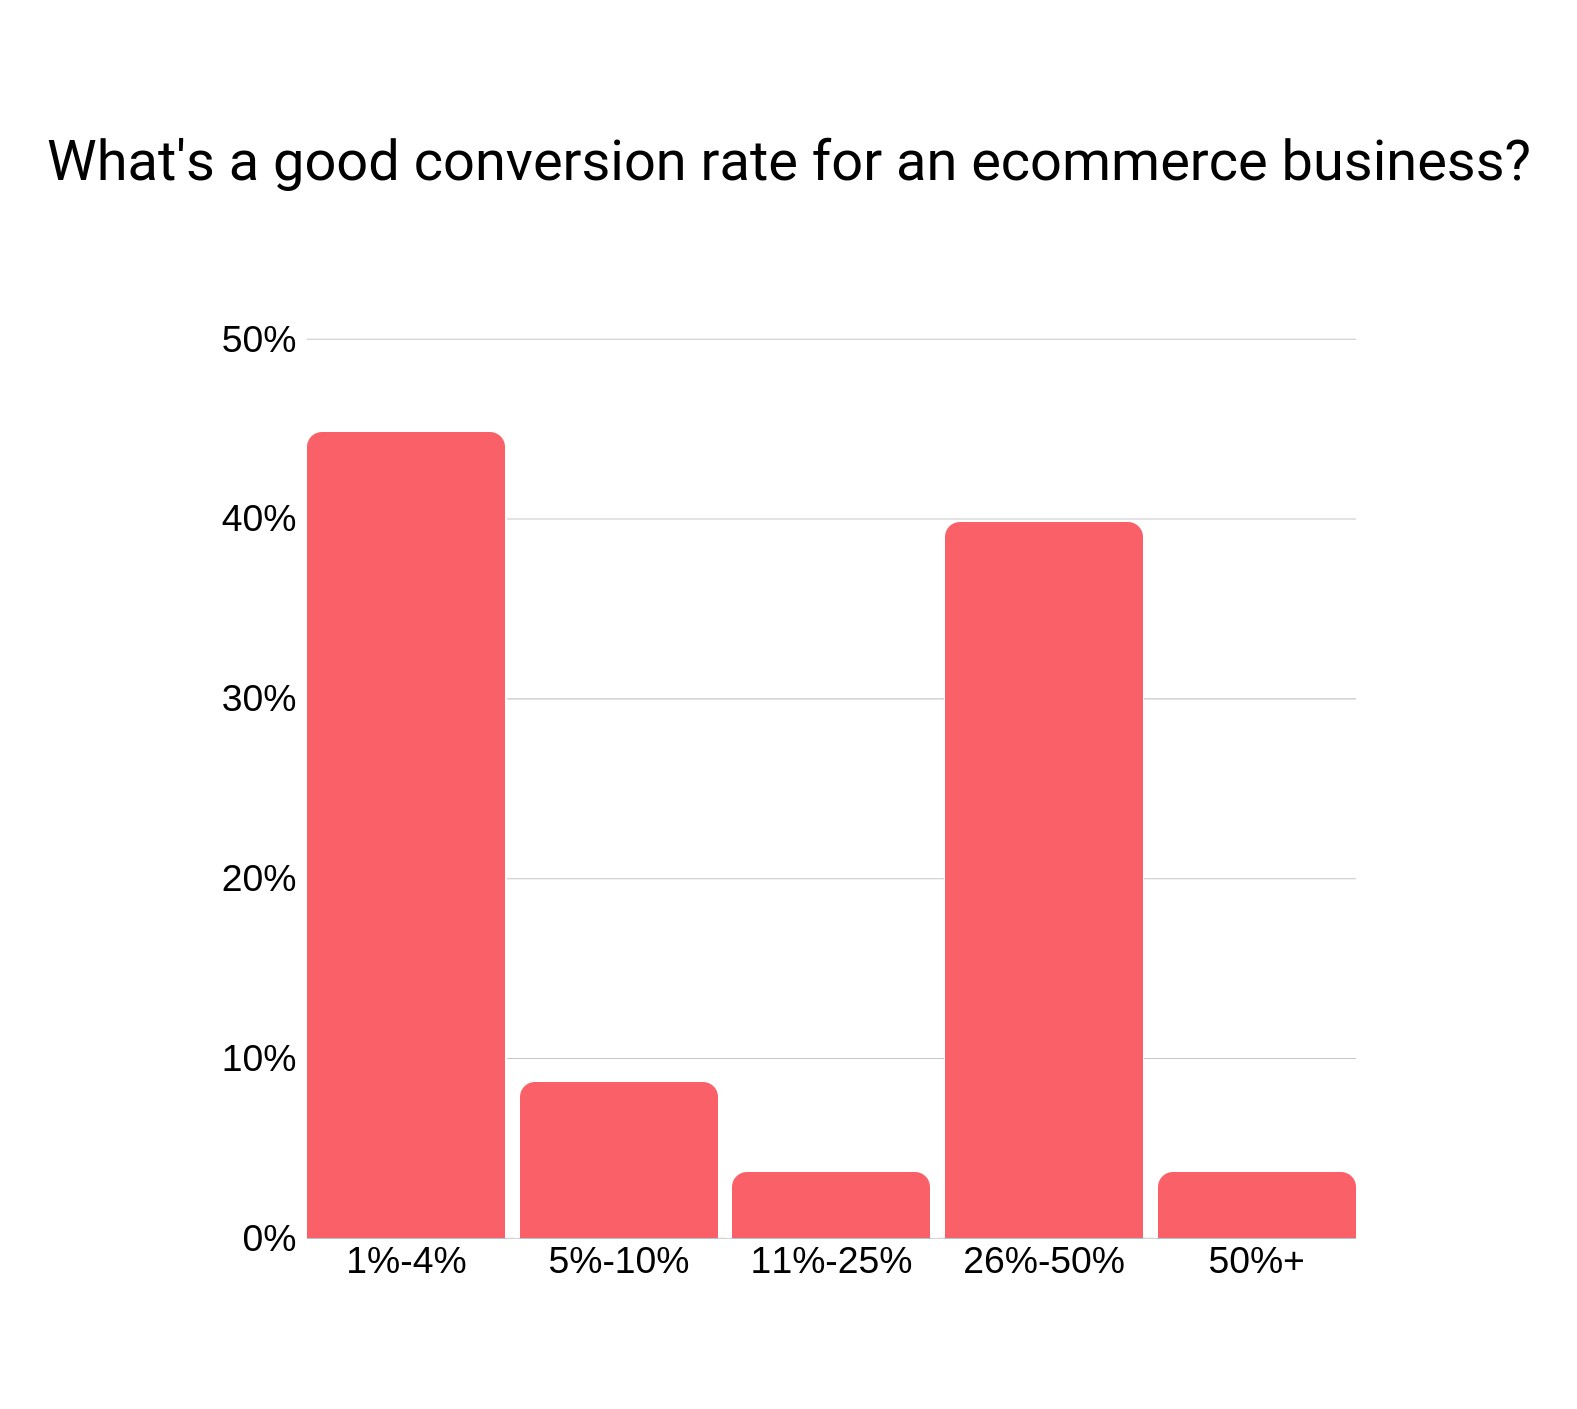
High conversion rates mean your business is doing super Good. In other words, it indicates that your sales strategies are succeeding. You should keep track of these conversions in case they drop.
Your conversion rate indicates how well your website encourages users to take action. Moreover, Knowing how many buyers visited your site can help you improve eCommerce success by revealing tendencies.
How Would You Keep Track?
Calculating the conversion rate is simple.
(Number of conversions ÷ Number of Leads x 100 = Conversion rate.)
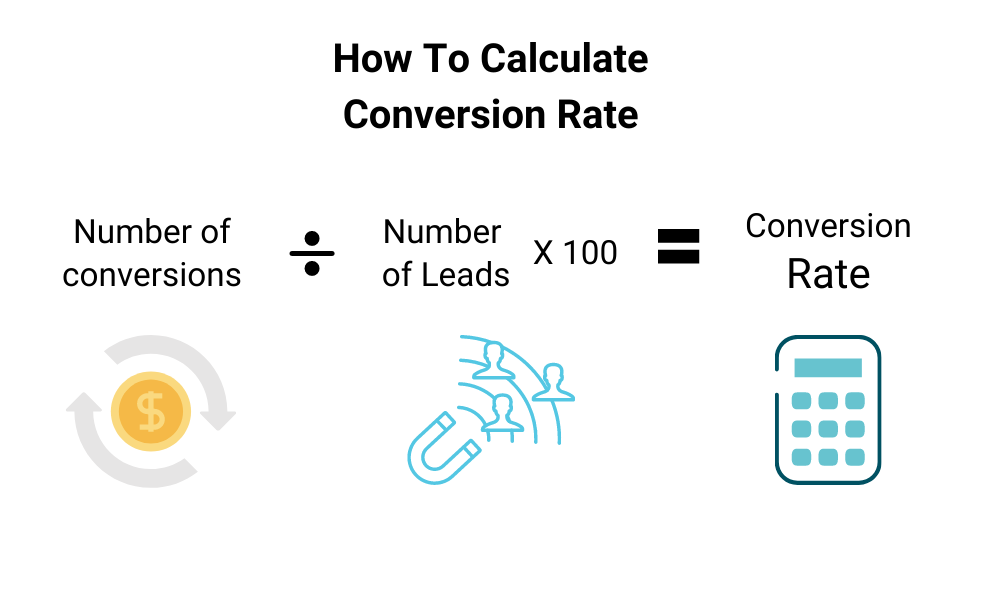
Let’s simply understand this process with the above formula:
If you get 200 sales out of 3000 visitors then your conversion rate would be like this:
(200 sales ÷ 3000 Visitors) x 100 = 6.6% Conversion rate.
3. Shopping Cart Abandonment
This is yet another eCommerce KPI that should not be overlooked.
Who likes to see incomplete checkouts?
Obviously no one.
An abandoned cart means, users, come to your site, like your products, and even add them to the cart, but they can’t make a checkout. That’s where all the problems start taking place.
Here are several factors that contribute to cart abandonment on your website. Those factors include your shipping cost, your checkout requirements, specific payment method, complicated process, discounts, and so on.
By tracking this eCommerce KPI, you can monitor issues and determine which issues are affecting your sales.
As a merchant, you must address whatever is causing your sales to suffer and ensure that the vast majority of your customers complete a successful checkout on your website.
How Would You Keep Track?
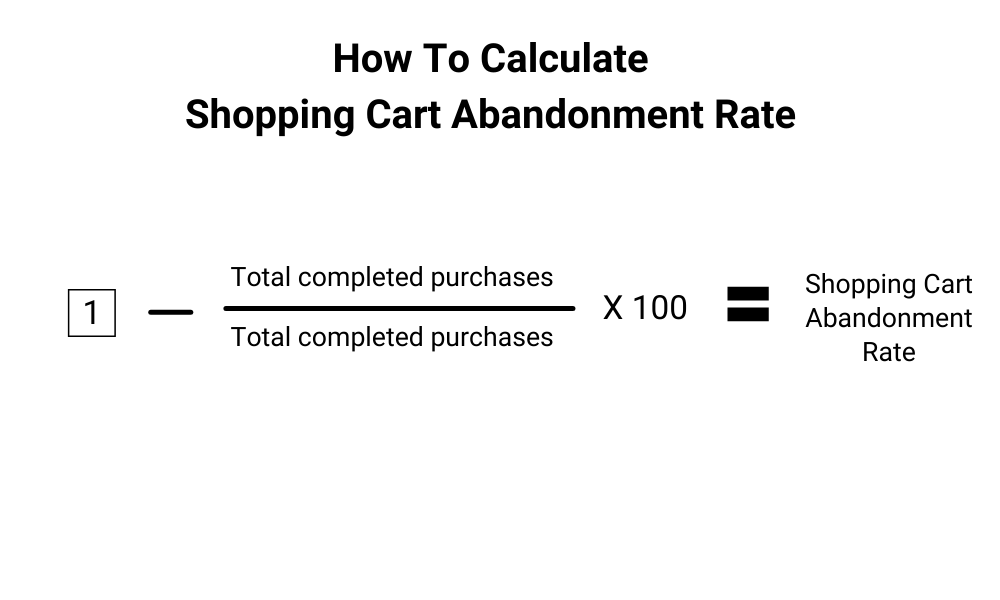
1 – (Total completed purchases / Total shopping carts created) x 100 = Abandonment Rate
4. AOV: Average Order Value
AOV stands for Average Order Value. It is another key performance indicator (KPI) that can be tracked to determine how much money a customer spends per order.
High AOV = Stable Revenues
Increasing AOV indicates that your income is growing.
Furthermore, by earning more money from each customer, you may accept greater customer acquisition costs while continuing profitably. The average order value provides useful information about the customer’s purchasing habits.
All in all, a higher AOV indicates that your store is generating a lot of money for the same amount of money spent on gaining new clients.
Let’s calculate it:
How Would You Keep Track?
Calculating AOV is way too simple.
Total Revenue ÷ Total No. of Orders = Average Order Value
Take your store’s total revenue and then divide it by the number of orders, there you’ll have an average order value.

For example,
Total revenue ($25,000) ÷ Number of orders (125) = $200 one month’s AOV.
5. Website Traffic
An eCommerce store owner’s first priority is to monitor their store’s traffic. The simple fact is that as your site traffic grows, so will your conversions and users.
However, in order to keep your site’s traffic growth, you must keep a keen eye on it, because when it begins to fall down, you will be aware.
Also, more traffic doesn’t mean more conversions. It could happen if your website receives a lot of traffic but no one buys anything or leaves immediately.
This leads to a high bounce rate and cart abandonment (which we just discussed). This implies that you must also keep track of it.
Generally speaking, the more traffic your site receives, the more popular, remembered, and chosen your store will be.
To monitor your site’s traffic, you can install a chrome extension called “SEOquake”. It will tell you the monthly traffic of your site and also let you know if the traffic comes directly from a referral, or from a search.
Google Analytics can also be used to determine where your traffic is coming from. Knowing where your traffic is coming from will be beneficial to you because it will show you where you need to be more focused.
That’s why web traffic is another more popular and important website KPIs to track.
6. CLV: Customer Lifetime Value
CLV is a very unique KPI to track, it is also often known as CLTV, LTV, and more. Put it simply, customer lifetime value is the total amount of money a customer spends with your brand over the entire period of their customer lifetime.
You might wonder, what’s the reason to track this KPI?
Well, it is. Understanding your clients’ lifetime value allows you to plan for the future while also informing your marketing and acquisition strategy.
Moreover, another reason to measure CLV is customer retention. Selling to repeat customers increases revenues dramatically and emphasizes the importance of client loyalty.
If you make your marketing strategies and USP up to the mark, you’ll receive new customers and more repeat purchases. Besides, when brainstorming new strategies to boost your CLV, keep your audience and products in mind.
How Would You Keep Track?
To calculate CLV:
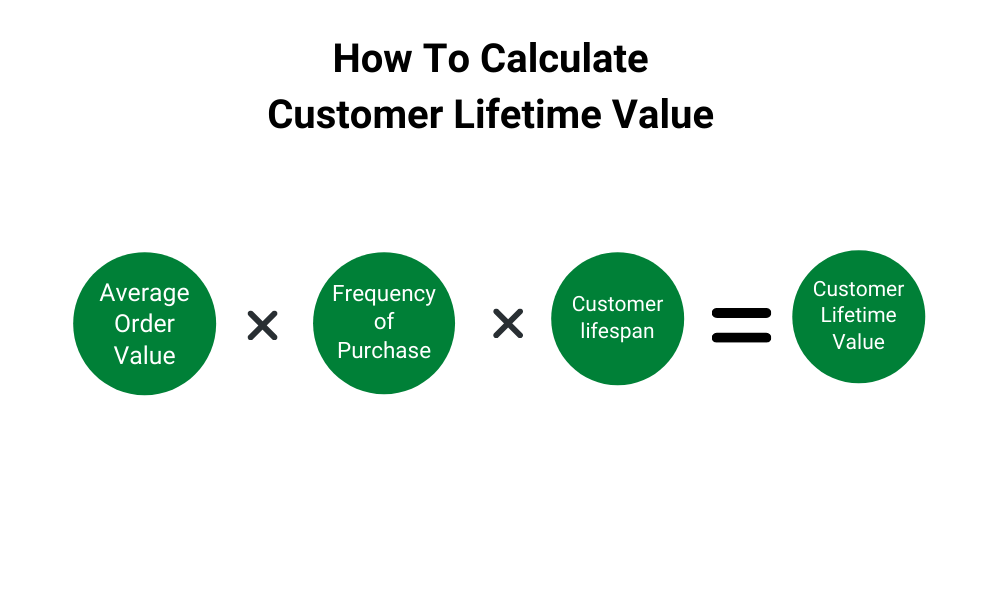
(Average Order Value x Frequency of Purchase x Customer lifespan = Customer Lifetime Value)
7. ROAS: Return On Ads Spent
You might know its meaning. ROAS stands for how much you’re earning back for every dollar you spent on the advertisement to get this revenue.
Every merchant should have this understanding of how much they are spending on the ads to drive more revenue for their business.
Don’t make a disaster for your business. Spending more on advertising than you are is a recipe for disaster for your business. So it’s vital to measure your spendings.
By tracking this KPI, you’ll be able to see which of your ads performed well and which did not. Furthermore, tracking ROAS will inform you whether or not you need to change your target audience, campaign, and so on.
How Would You Keep Track?
To calculate ROAS,
(Generate revenue from advertising / Total cost of ads = Return On Ads Spent)
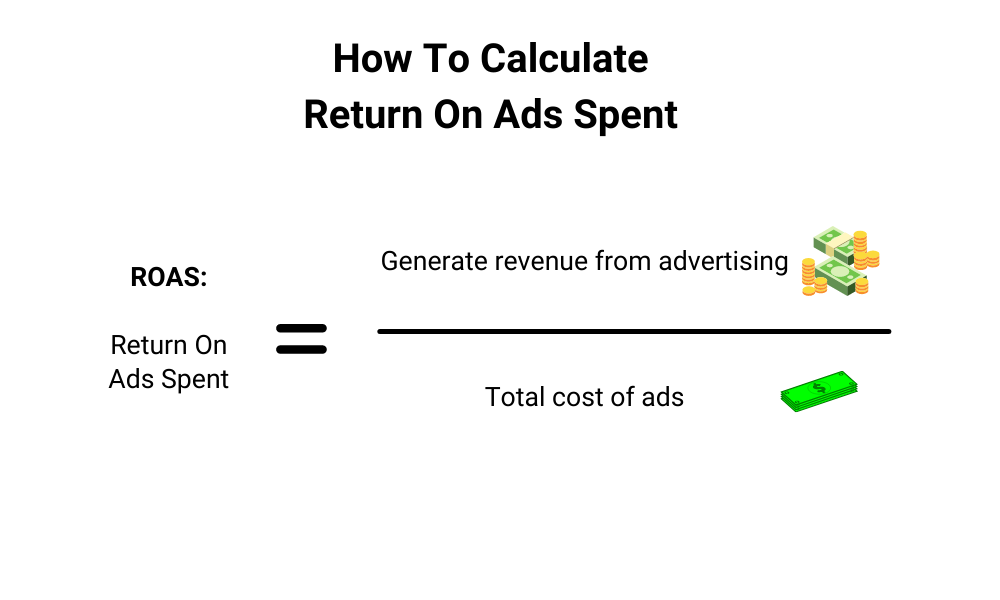
Let’s understand it with one example:
If you want to run an ad on a specific campaign, and if you spend $1000 and suppose if your campaign drives more than the amount you spend on the ads.
Let’s say, it would be $6000.
Then you have successfully generated $5000 revenue.
$6000/$1,000 = 6
8. GPM: Gross Profit Margin
Simply put, the gross profit margin is the amount of profit generated after deducting all operating expenses such as marketing costs, salaries, and other expenses.
It’s a simple concept that almost all of us are already aware of. However, there are still some store owners who fail at calculating GPM.
Every merchant should be aware of how much they are generating after subtracting all the other expenses. Because if they continue to run without measuring their GPM, sooner or later they would see a drastic loss in their business.
That’s why it is essential to calculate. By calculating GPM, you’ll have a record of each and every expense in your business.
This will also assist you in determining whether to raise the price, reduce expenses, or discontinue the product.
Let’s understand GPM with an example:-10 Key Performance Indicators (KPIs) for Your Ecommerce Store’s Growth
If you are in the garment business and this month you purchased one lot for around $2500 (including other miscellaneous costs) and sold it for $4000.
Your GPM would be around $1500.
How Would You Keep Track?
To calculate the GPM, we’ll use the below formula:
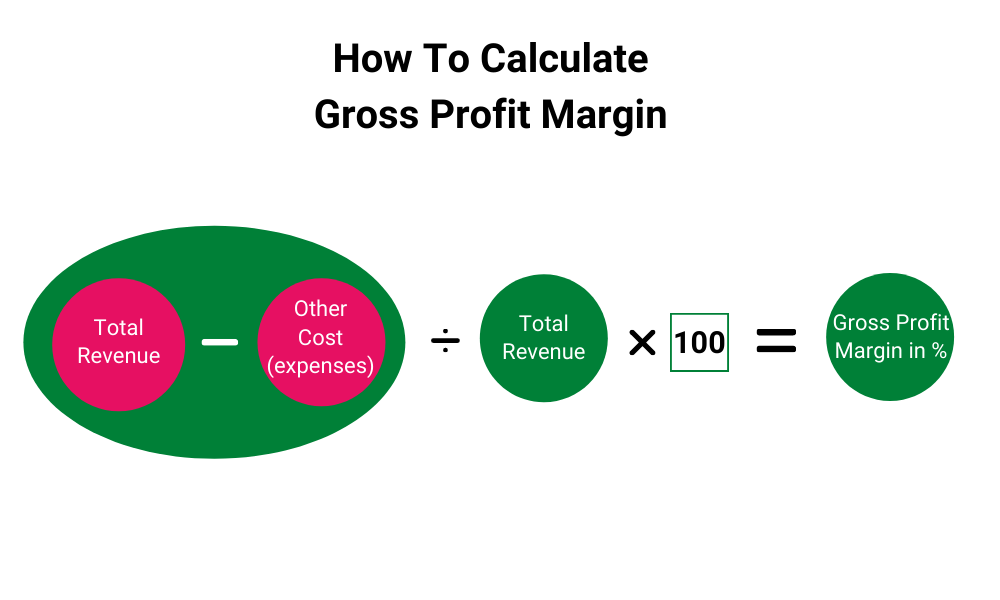
Total Revenue – Other Cost (expenses) = Gross Profit
Subtract all of your extra costs from your revenue, and you’ll be left with your net profit. NOW, let’s calculate the percentage.
To calculate percentage:-
[Total Revenue – Other Cost (expenses)] ÷ Total Revenue x 100 = Gross Profit Margin in %)
9. CPC: Cost Per Conversion
CPC is another KPI to keep an eye on. It is commonly used in Google Adwords. It’s the fee you pay Google to convert a visitor into a paying customer.
Is CPC hard to understand? Let us make it easy for you. There are several factors that influence your cost per click, including your maximum bid, quality score, and the ad rank of other advertisers competing for the same keyword.
Furthermore, CPC is an important metric because clicks and expenditures pile up quickly. You will not be able to gain a return on your advertising spend if your CPC is too high (ROI).
As a result, we recommend that you monitor your CPC on a regular basis. You can become more profitable and gain a competitive edge in the market if you have a thorough understanding of CPC.
10. Bounce Rate
The reason behind the low engagement and conversion rate is the bounce rate. Bounce rate is the main culprit whether it’s an eCommerce site or any other website.
A high bounce rate means, your website users come to your site (a single page) and immediately leave without further interaction with the rest of the website.
In other words, Bounce rate is when a customer comes to your store to purchase and when they don’t find what they want they’d immediately exist.
One of the most common causes of a high bounce rate is an unattractive theme & responsiveness. Your store’s theme should be appealing to users and include all of the necessary & modern features.
Another factor that contributes to a high bounce rate is relevance, which indicates you’re ranking or targeting the wrong group of individuals who aren’t in your specialty.
For example, if your store sells “boots” and you only target the phrase “boots,” but your customers are particularly seeking “hiking boots.”
That’s an irrelevancy. You must need to let your customers know what you’re particularly selling.
Despite the fact that this KPI applies to everyone who leaves your site without completing a purchase. The bounce rate of your website is taken into account by Google when determining how to rank you for specific keywords, so keep an eye on this KPI.
This KPI is highly essential to monitor because it allows you to identify a variety of reasons that cause potential customers to leave your product page as soon as they open it.
How Would You Keep Track?
Calculating the bounce rate is fairly easy.
Total number of one-page visits / Total number of entries to a website = Bounce rate
Last Words On Ecommerce KPIs
So that was all about the eCommerce KPIs. We know that eCommerce KPIs can be confusing, overwhelming, and frustrating to many. It is also difficult to apply. But after all, it is beneficial to thousands of businesses around the world. 10 Key Performance Indicators (KPIs) for Your Ecommerce Store’s Growth
Which KPI do you want to master the most?
So, that was much about the “10 Key Performance Indicators (KPIs) for Your Ecommerce Store’s Growth” for any queries or doubts reach out to us at [email protected]. You can also raise a ticket at our HelpDesk System.


Be the first to comment.